"Our energy company needed a better way to monitor consumption patterns and manage distribution effectively. Luminar Analytix built an interactive dashboard that clearly mapped out our energy usage and grid performance. With AI-powered forecasting to predict demand spikes and automation that simplified data updates, we can now reduce wastage and…
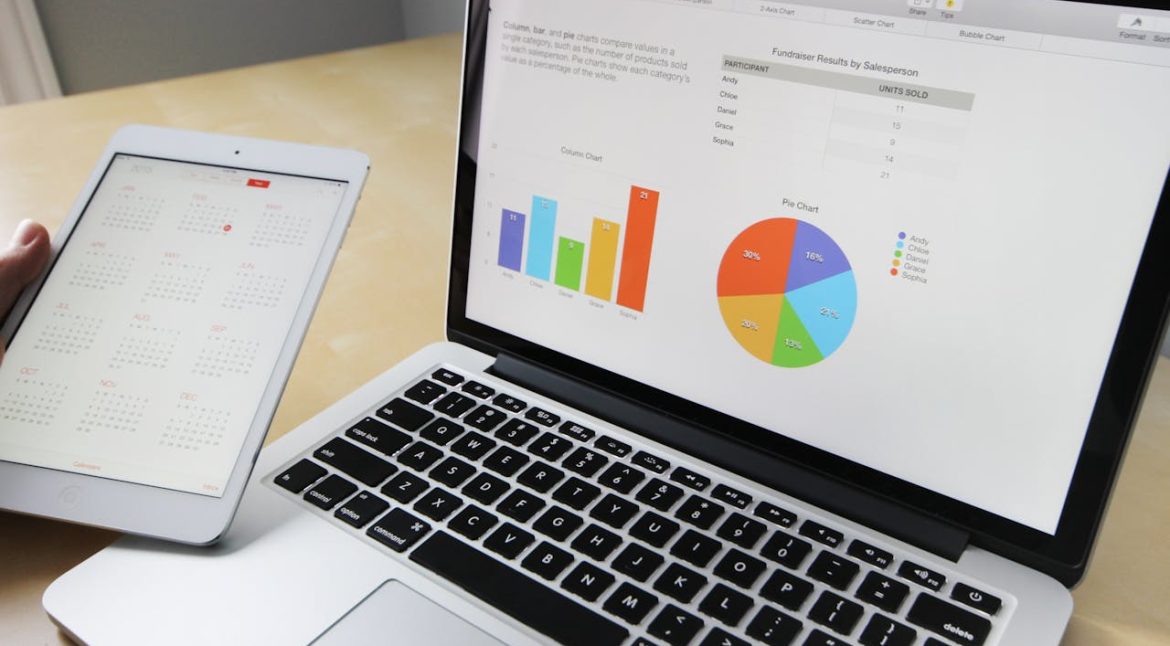
''Running a luxury hotel chain means understanding guest feedback is vital, yet our data was all over the place. The Luminar team crafted a data visualisation tool that neatly compiles guest satisfaction scores alongside occupancy figures. This user-friendly dashboard has allowed our management to quickly pinpoint areas for improvement, resulting…
-
By
admin
-
December 15, 2020
''As a mid-sized bank, monitoring risk and regulatory compliance was a constant challenge due to scattered information. The Luminar team created a bespoke data visualisation tool that mapped out our risk metrics and compliance reports in a simple yet powerful format. Automated reporting features ensured we received timely updates, giving…
-
By
admin
-
December 13, 2020
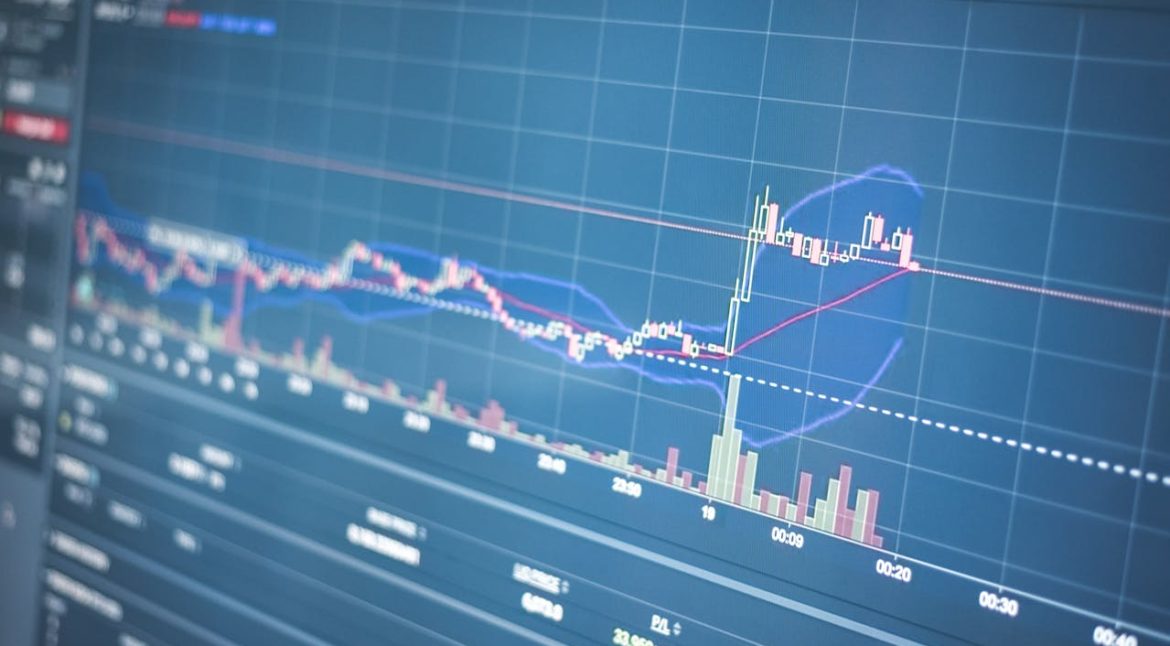
''We were struggling with multiple sources of financial data that slowed our decision-making at the investment firm. Luminar Analytix stepped in with an interactive dashboard that consolidated market trends and portfolio performance into a single, easy-to-navigate interface. The clear visualisations and predictive AI insights allowed us to act swiftly on…
-
By
admin
-
December 11, 2020
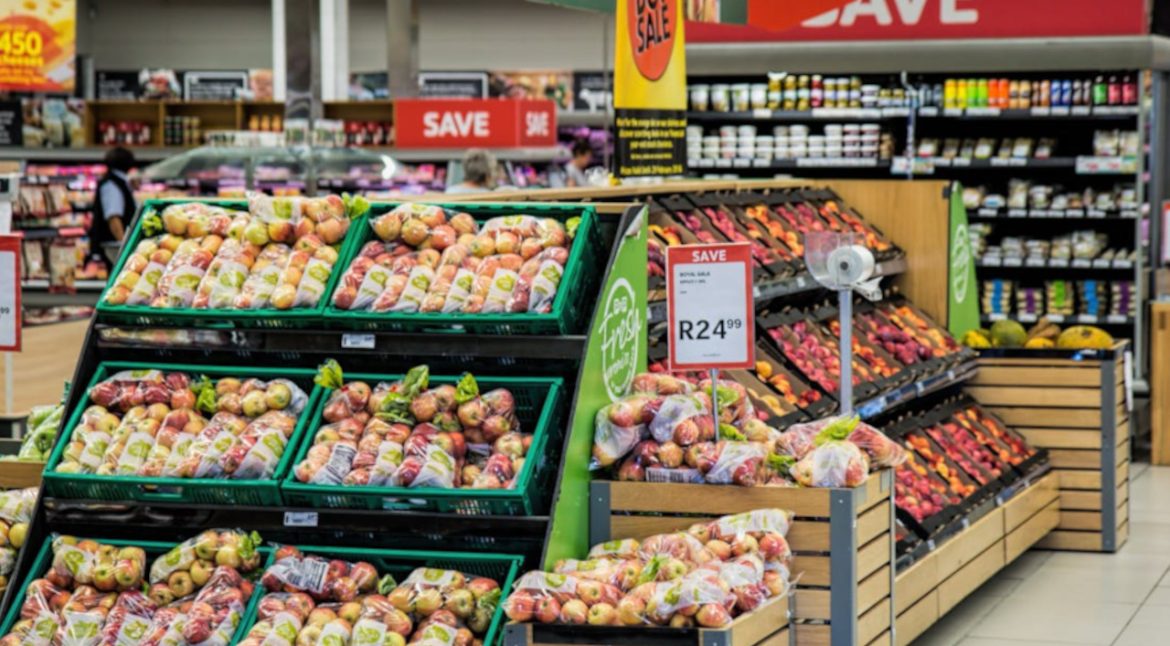
''Our retail chain was caught in a cycle of stock imbalances, with either empty shelves or surplus inventory. Luminar Analytix provided us with an interactive dashboard that clearly displayed sales trends and inventory levels across all our stores. The ease of use meant even our non-technical team members could interpret…
-
By
admin
-
December 9, 2020
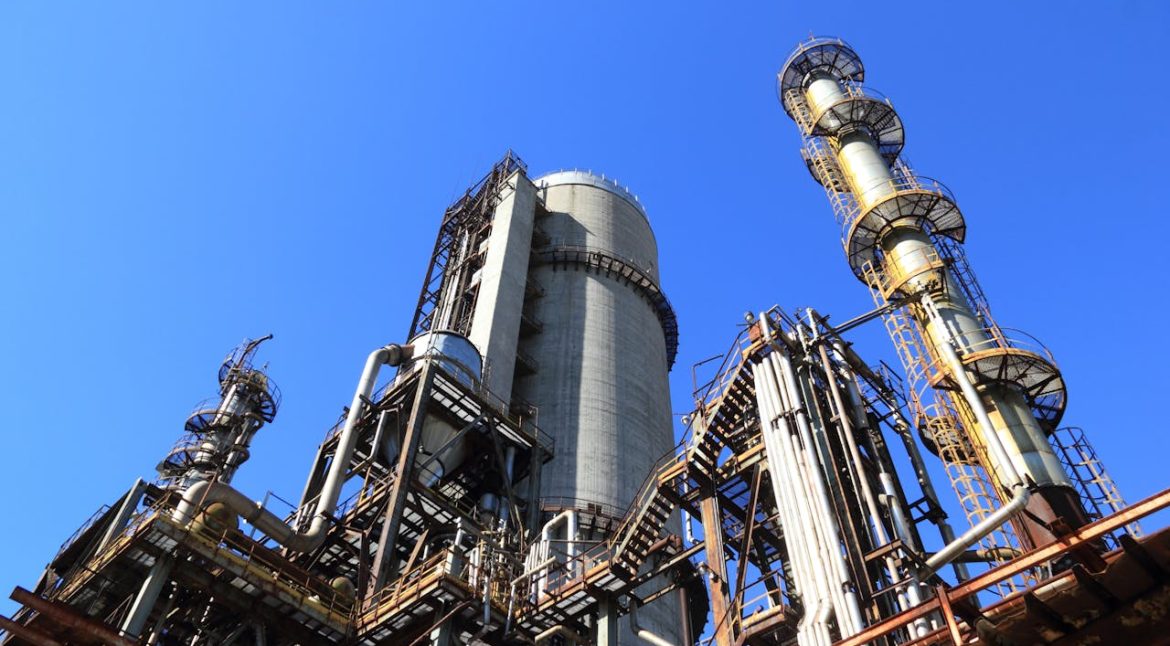
''In our manufacturing plant, manual reports were delaying our response to production issues. The Luminar team delivered an interactive dashboard that provided real-time insights into machine performance and quality control. This visual tool has empowered us to spot problems early, streamline our processes, and improve overall product quality while reducing…
-
By
admin
-
December 7, 2020
''Our transportation company was struggling with route inefficiencies and frequent delivery delays. Luminar Analytix introduced an interactive dashboard that integrated live GPS data and traffic information, making it easy for us to monitor fleet performance. The clarity of the visualisations enabled our team to optimise routes and reduce delivery times…